What is going on with this question? (2020 HSC Economics Q20)
I was reviewing the 2020 Economics HSC Exam and found myself frustrated with Q20. After flipping the table, I decided to figure it out for myself.
Let’s start with the question — see below. There’s a lot going on here for one mark.

Source: NESA
Step one: What the hell is going on?
If you look at the first part of the question and the graph, the labour market starts at We. This is the equilibrium wage. At We, the demand for labour equals the supply of labour — there is NO UNEMPLOYMENT. It’s really important we set this up.
Step two: The government sets a minimum wage
The government decides to set a minimum wage which sits ABOVE the equilibrium wage. The government has decided that the equilibrium wage is too low and therefore it should be higher.
The minimum wage is a price floor. This is because the price cannot fall below the level of W1.
But let’s think about what happens with the price floor. Now, supply of labour exceeds demand (see my annotations below). This means that there will be unemployment in the economy because, at a higher wage, more workers are willing to supply their labour BUT employers demand fewer workers because they are more expensive at W1.
I’ve identified the size of unemployment in the graph below.

My annotations. At We, there is no unemployment — demand for labour and supply of labour are equal. Notice how at W1 we get unemployment (UE) where the supply of labour exceeds the demand for labour.
Step three: The Lorenz Curve comes into play
The Lorenz Curve is a measure of income inequality. Have a look at the curve below. You’ve got the line of perfect equality and then the Lorenz Curve.
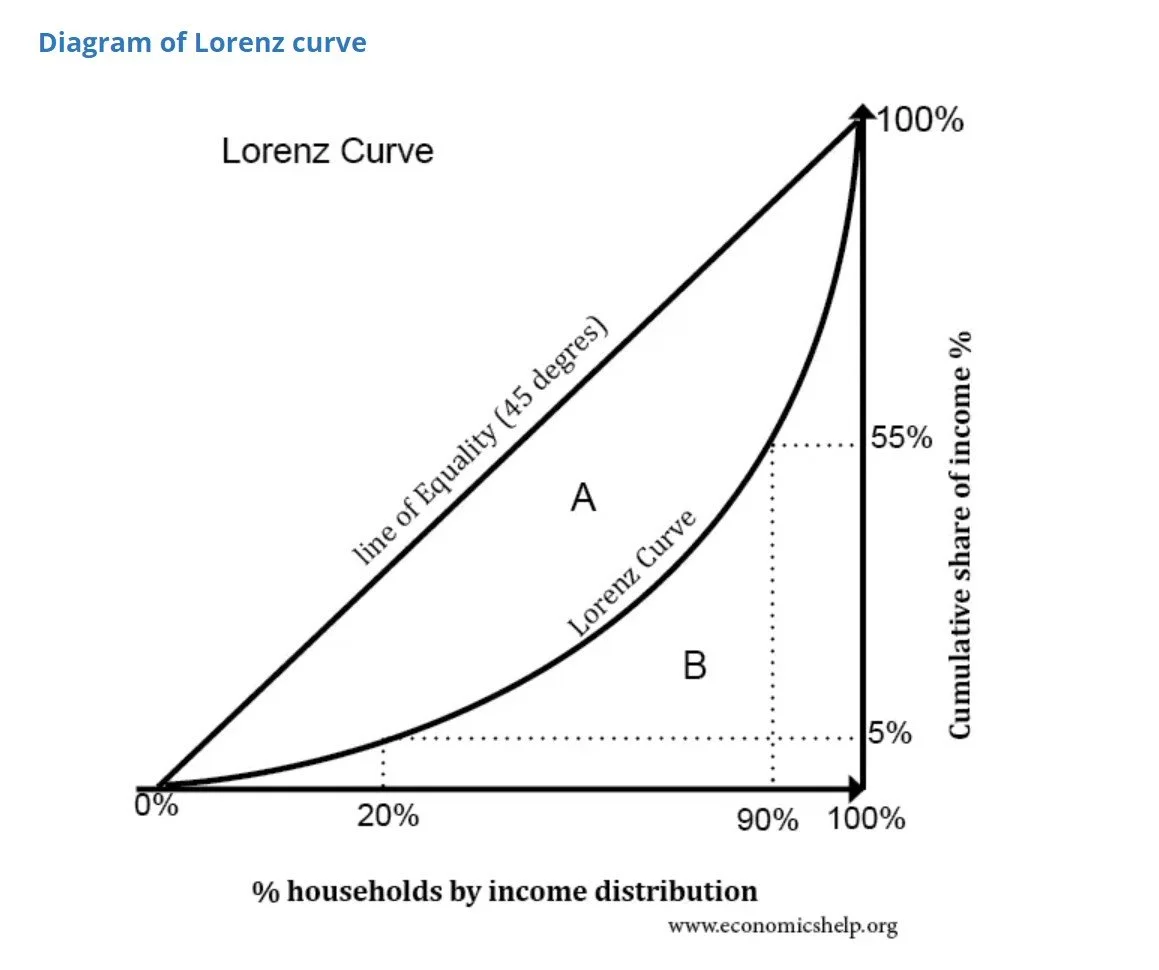
Source: economicshelp.org
If the Lorenz Curve moves left, it is moving closer to the line of perfect equality. So income inequality is improving. This is a move inward of the Lorenz Curve.
If the Lorenz Curve moves right, it is moving further away from the line of perfect equality. So, income inequality is worsening. This is a move outward of the Lorenz Curve.
The question wants us to think about the impact on the Lorenz Curve on the minimum wage.
Step four: What’s the answer?
Now, let’s go through the possible answers.
A: The Lorenz Curve would move inwards as all employees receive a higher wage.
This is incorrect. Not all employees receive a higher wage. Only those who are on the minimum wage would receive a higher wage. So we can eliminate this response.
B: The Lorenz Curve would move inwards as there is an increase in the level of employment.
Go back to the graph. When the government imposes a minimum wage, there is not an increase in employment. Instead, there is an increase in unemployment because, at W1, the supply of labour EXCEEDS the demand for labour. So we can eliminate this response.
C: The Lorenz Curve would move outwards as all employees receive a higher wage.
If we go back to answer A, we can see that all employees DO NOT receive a higher wage. Only those on the minimum wage receive a higher wage. So we can eliminate this response.
D: The Lorenz Curve moves outwards as there is an increase in the level of unemployment.
Okay. So we know that the level of unemployment rises because the supply of labour exceeds the demand for labour. But would the Lorenz Curve move outwards?
The graph shows us that unemployment rises. Who loses their jobs? Those on the minimum wage who now earn more money (W1>We). This means that low income earners would earn less income (i.e. now income because they’re unemployed), which could worsen income inequality. This would cause the Lorenz Curve to move outwards.
Our answer is D. It takes a lot of work to get there.
My advice to you
With the multis, do everything you can to eliminate as many answers as possible. You can see that by ruling out the least likely, we came to the correct answer. Make it at least a 50/50.