Scared consumers save more
Consumers can save or spend their income. This comes back to the identity Y=C+S.
Yes, consumers have to pay tax. And yes, consumers can use their savings to invest. The key part is that, when consumers receive their pay, they can either spend it now or put it away for later (savings/investment).
My point: the level of savings depends on consumer confidence, and consumer confidence is substantially affected by the economic outlook.
Let’s explain with the use of a graph.
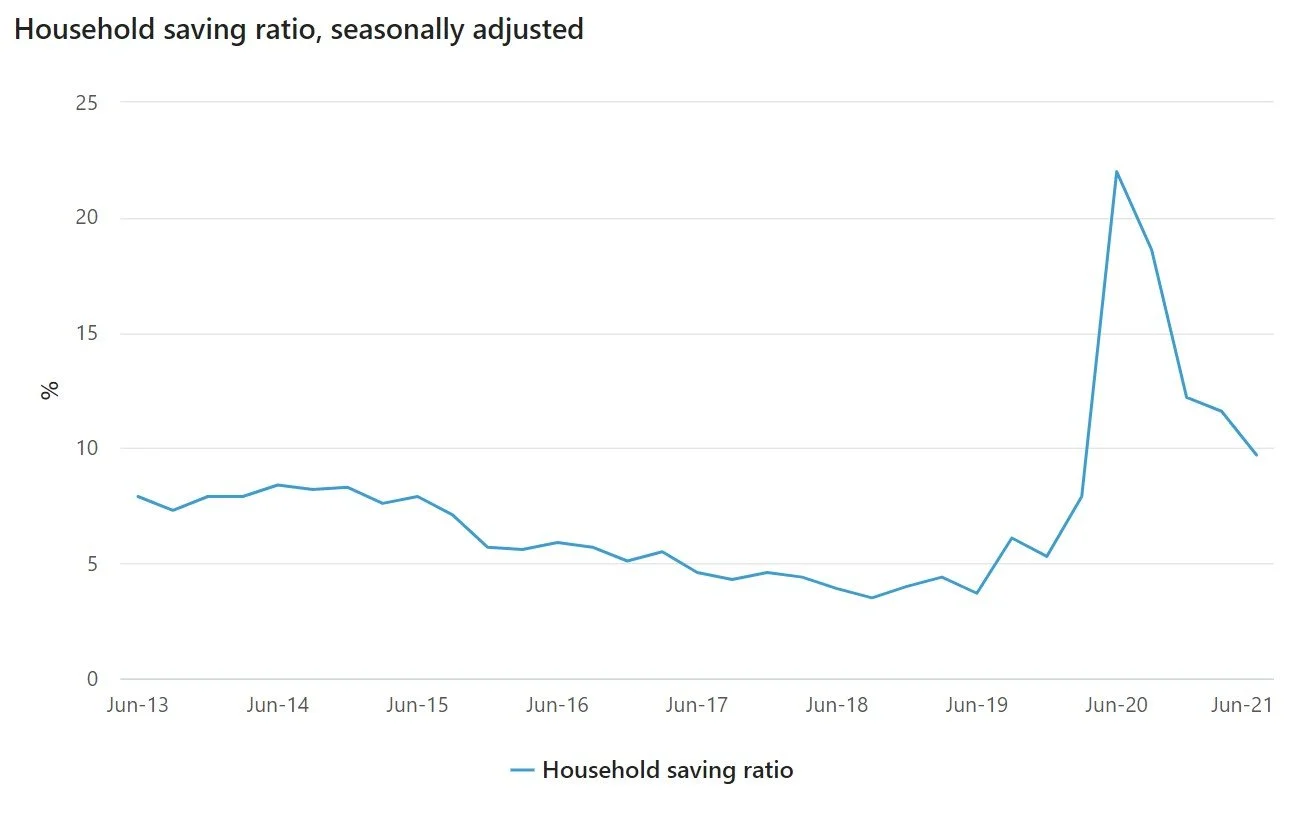
The graph above comes from the Australian Bureau of Statistics from the June quarter national accounts 2021.
Focus on the time frame from around June 2013 until June 2019. You can see that the household savings ratio varies between around 5ish to 9ish per cent (very precise!). This means that, on average, for every $1 of income households earn, they are saving somewhere between 5 and 9 cents. They’re generally spending MOST of their incomes.
Now focus on March of 2020 — see how the savings ratio spikes? This was the first wave of COVID-19 and consumer confidence plummeted. How did consumers respond? By saving a larger chunk of their incomes. In fact, in the June quarter of 2020, the household savings ratio rose to 22 per cent — meaning households were now saving 22 cents for every $1 they earned.
This all comes down to consumer confidence. When the economy is going well, consumers feel confident in the future. They feel confident to spend their money because they believe that the good times will continue and their ability to earn income, to continue spending, will, well, continue!
(You could also think about how their marginal propensity to consume would be higher during ‘good’ economic conditions).
When consumers fear for the future, such as during the height of the first wave of the pandemic, they’ll reduce spending. They don’t know what the future holds. They want to hang on to their funds because they are unsure whether they can continue to earn the same level of income.
(You could think here about how the marginal propensity to save would be higher.)
I’ve annotated the above chart to summarise this info.

I think the household savings ratio is an extremely important statistic. It gives us, as economists, a good indication of consumer confidence. This also has implications for economic growth. This is because savings is a leakage and represents a withdrawal of funds from the economy. The higher the level of saving, the lower the level of consumption, which will put downward pressure on GDP.
I’ve also got a video on the topic you can check out below.