Economic growth is the worst
A quick summary
Economists push the need for more and more economic growth
But economic growth has very serious negative consequences
But also: economic growth is super important. It boosts people’s living standards and creates the resources to fund a range of economic initiatives
The challenge is how to grow in a way that mitigates some of the negative impacts
Don’t be fooled
“Economic growth is terrific.”
You hear this from your teacher or an economist or maybe even a politician.
But I implore you: be skeptical of this claim. Economic growth is terrible*.
I’ve got four reasons why economic growth sucks. Or, in a more articulate way, there are four negative consequences of economic growth.
(*Please read all the way to the end.)
Economic growth is terrible because it results in higher prices
Let’s say economic growth is rising in an economy. So aggregate demand is rising…however, firms may not have enough time to increase production to match this rise in demand.
Look at it from this perspective. As the economy grows, consumers’ incomes rise. This means they can afford more goods and services. However, there is limited stock of goods and services.
“In fact, consumers use their extra income to ‘bid up’ the prices of limited goods and services, which then results in higher prices. I like to think about extra money ‘chasing’ the same amount of goods and services.”
So we would say that the rise in aggregate demand is outstripping aggregate supply (because firms haven’t had time to produce more goods and services). This leads to demand-pull inflation.
[Just remember: aggregate demand affects economic growth in the short term, while aggregate supply affects growth in the longer term.]
But we may also see cost-push inflation. This is because higher economic growth leads to greater demand for the inputs of production, which will lead to higher costs for businesses.
Think about it this way: economic growth leads to greater demand for labour, which will result in lower unemployment. As firms need more and more workers, they will need to pay higher wages to poach them from other firms (because unemployment is so low). This leads to higher inputs costs (wages) which will result in firms pushing up the prices of goods and services (cost-push inflation).
Also, during a period of economic growth, many firms will demand more inputs to meet the higher demand for goods and services. As a result, the prices of inputs like raw materials will also rise and this will further lead to cost-push inflation.
Learn more about cost-push inflation
Economic growth is terrible because it results in higher prices and then higher interest rates
As we’ve seen in the previous section, higher economic growth generally leads to rising inflation.
If inflation is rising in Australia, the central bank will act. The Reserve Bank will raise the cash rate, the official level of interest rates, to indirectly increase interest rates across the economy and slow inflation.
What’s the issue with the higher rates?

The RBA will act.
Australia’s central bank will adjust the cash rate if inflationary pressures are rising.
Higher interest rates will result in less investment. This is because higher rates mean higher interest repayments for borrowers.
Higher interest rates could also result in a higher exchange rate. This is because more foreign investors could be motivated to save their money in Australia as the returns could be higher. A higher exchange rate could make Australian exports less competitive.
Economic growth is terrible because it results in environmental degradation (and therefore lower living standards)
Economic growth is still highly dependent on the use of fossil fuels. In order to increase output, we need to use non-renewable resources, such as oil and minerals, which reduces the ability of future generations to harness these resources.

The more economic growth, the more pollution.
In addition, the use of fossil fuels leads to higher pollution. This leads to environmental degradation (which may not be fixable) and potentially lower living standards. Think about how pollution could result in poorer air or water quality. This has negative implications for future generations.
Economic growth is terrible because it can worsen income and wealth inequality
This is a trickier point. One view is that economic growth will reduce income inequality as it results in higher wages for lower-income earners. Or that it leads to the unemployed gaining jobs which then leads to them having higher wages. And overall, income inequality is reduced.
There’s another view to consider.
The wealthier people in society own more assets, including shares, homes and investment properties. So if the economy grows and asset values rise, this would deliver greater benefits to those who are already wealthy. They would receive greater dividends, rent and other incomes flows from their assets. According to this view, as economic growth rises, income and wealth inequality could rise.
*But we need economic growth
Yes, economic growth has negative consequences. Quite serious negative consequences in some cases. But we need economic growth.
This blog post has a deliberately sarcastic tone. Don’t start writing essays where you make the case for GDP growth of 0%. This will be unhelpful for your marks.
You see, economic growth delivers so many benefits to a country and its population, including rising living standards and higher wages.
The issue here is how we pursue economic and growth and what do we do with the benefits of economic growth.
For example, could countries try to grow more sustainably, with less of a reliance on fossil fuels? And could countries direct some of their benefits from economic growth to addressing some of the negative consequences of growth?
We can’t choose not to grow. But we can talk about how economies should choose how they grow.
How do movements in the TERMS OF TRADE affect the Australian economy?
Quick summary
Australia’s Terms of Trade is the ratio between export prices and import prices for the economy. It is a ratio that involves prices, NOT volumes
An improvement in the Terms of Trade means export prices are rising faster than import prices. This is likely to lead to higher economic growth and rising living standards
An improvement in the Terms of Trade means import prices are rising faster than export prices. This could accelerate AND slow economic growth (confusing!) but would likely lower living standards
Thanks for the question Emily!
Big shout out to Emily S for her great comment below.

[VCE is the final high school exam for students in Victoria.]
I read Emily’s question and it set my brain on fire. What a great question. Time for a comprehensive answer.
I’m going to go beyond Emily’s scope and discuss the impact of a favourable and unfavourable movement in the Terms of Trade. I hope she doesn’t mind.
What is the Terms of Trade?
It’s worth starting with a definition: the Terms of Trade (TOT) is the ratio of export prices to import prices.
The terms of trade index = (export price index/import price index)*100
The TOT is a measure of the prices of exports and imports. It does NOT measure volumes.
Think about it this way:
Export prices represent income for an economy. If Australia sells exports to China, the goods or services go to China BUT the revenue arrives in Australia. Exports are an injection for the Australian economy.
Import prices represent a cost for an economy. If Australia buys imports from China, the goods or services arrive in Australia BUT income leaves Australia and arrives in China. In this way, imports are a leakage for the Australian economy.
What does the Terms of Trade show?
For an economy, exports represent revenue and imports represent costs.
If exports prices rise relative to import prices (so export prices rise faster than import prices), then a country can afford to buy more imports with the same volume of exports.
If import prices rise relative to export prices (so import prices rise faster than export prices), then a country can afford to buy less imports with the same volume of exports.
Here’s a way to think about it. Export prices represent the amount of income Australia earns. If Australia earns more (export prices rise in relative terms), it can buy more stuff. And stuff = imports.
If Australia earns less (export prices fall in relative terms), it can buy less stuff. And stuff = imports.
Still confused about what the Terms of Trade means?
Check out my video setting out the concept.
What happens to the Australian economy when the Terms of Trade improves?
This is what’s known as a favourable movement in the TOT.
When the TOT improves, this means export prices are rising faster than import prices.
If export prices are higher, this means that Australia is earning more revenue from the sale of exports. This is because for every export sold, Australia receives more revenue (NOT PROFIT).
When Australia’s TOT improves, this is usually due to higher prices for Australia’s natural resources and/or rural commodity exports. These rising prices send a signal to investors that demand for some of Australia’s exports is growing and it may be a good time to invest in the natural resource and rural sectors. If they invest now, they can hopefully earn a higher return as the growth continues.
So, there are a number of consequences from this change in the TOT:
There will be greater investment in Australia’s export sectors. This will increase capital inflows (foreign direct investment and portfolio investment) and lead to greater income outflows (as recorded in the Balance of Payments)
There will be greater demand for workers in the export sectors. Rising prices are due to higher demand; higher demand means that local firms may need extra workers to meet the rising demand. The extra foreign investment means they are extra resources to pay for more workers. As a result, employment could grow in the export sector.
In addition, a favourable movement in the TOT means that Australians can now buy more imports with the same volume of exports. This means Australians can afford more goods and services. As a result, living standards will improve.
Let’s go back to Emily’s question (not her real one but my expanded one)
How would a favourable movement in the TOT affect strong and sustainable economic growth and living standards?
Economic growth will rise.
This is because export volumes are likely to be rising. Rising prices are a signal of higher demand. Exports are a component of aggregate demand. So: higher export sales, higher economic growth.
This is also because investment is likely to be rising. This is because more people will invest in Australia’s export industries when prices are rising. Investment is a component of aggregate demand. So: higher investment, higher economic growth.
And then living standards will be higher. This is because Australians can buy more imports (good and services) with the same volume of exports. This, in turn, is because exports command higher prices.
What happens to the Australian economy when the Terms of Trade worsens?
This is what’s known as an unfavourable movement in the TOT.
It is also referred to as a deterioration in the TOT.
When the TOT worsens, this means export prices are rising faster than import prices.
If export prices are relatively lower, this means that Australia is earning less revenue from the sale of exports. This is because for every export sold, Australia receives less revenue (NOT PROFIT).
When Australia’s TOT deteriorates, Australians can buy fewer imports with the same volume of exports. This means that Australians can afford fewer imported goods and services. Therefore, living standards will worsen.
If Australia’s export prices are relatively lower, then there could be less interest in investing in Australia’s export sectors. This could reduce capital inflows (FDI and portfolio) and then reduce the size of income outflows.
Here’s a tricky part. If Australia’s TOT worsens, then Australia’s exports command relatively lower prices. This could actually make them more competitive. As a result, we could see greater demand for Australia’s exports. This would lead to greater sales of export volumes, which would boost aggregate demand and economic growth.
Basically: if the TOT worsens, then Australia’s exports are relatively cheaper. This means Australia could sell more and economic growth could improve.
Let’s go back to Emily’s actual question
How would an unfavourable movement in the TOT affect strong and sustainable economic growth and living standards?
Living standards would be lower. This is because Australians could afford fewer imported goods and services. Why? Because the same volume of exports can now purchase a smaller amount of imports.
For economic growth, there are some competing events.
Export volumes could be falling. This is because fallings prices are a signal of lower demand. Exports are a component of aggregate demand. So: lower export sales, lower economic growth.
Then investment could be falling. This is because less people will invest in Australia’s export industries when prices are falling. Investment is a component of aggregate demand. So: higher investment, higher economic growth.
But! If exports are relatively cheaper, then more people may wish to buy them. These exports are now more internationally competitive. This could increase export volumes and increase economic growth (over time).
Which factor would have a bigger impact? It would depend. But if you discuss both possibilities (higher and lower growth), this shows the marker you understand the complexity of this economic theory.
The connection between elasticity and the Terms of Trade
Elasticity of demand relates to the sensitivity of quantity demanded to a change in price.
If export prices rise, we would usually expect the demand for export prices to fall. This would be true for elastic goods. A small rise in price would lead to a large fall in quantity demanded.
But what happens if quantity demanded is inelastic? This means that a moderate rise in price may only lead to a small fall in quantity demanded.
We can consider Australia’s commodity exports as relatively inelastic. This is because they are high quality, highly sought after and available in large quantities. So even if the price of these exports rise, countries such as China will still want to buy large amounts of exports.
So if the exports are relatively inelastic, even if the TOT improves, other countries will still purchase large volumes of Australia’s exports and economic growth will rise.
Ask your questions!
Thanks again to Emily for the question. Hopefully this answer helps. Send me your questions!
Now take a look at recent developments in Australia’s Terms of Trade in the video below.
The circular flow of income: problems with the model
As part of your Economics study, you’ve probably done the Circular Flow of Income Model. This is also known as the Five Sector Model or the Five Sector Circular Flow of Income Model.
Here’s my explainer on the model. I’ve also written about how the Circular Flow of Income Model helps us understand economic growth.
The Five Sector/Circular Flow model is useful. I like it a lot, I use it all the time. But it’s not perfect. Here are some limitations you should be aware of.
A general limitation: The model heavily simplifies the economy
An economy is an extremely complicated thing. Can we really simplify something so complex into five sectors and 10 flows?
Just think about the household sector. Do all individuals within households act in exactly the same way? What about firms, or financial institutions? It’s hard to lump all these groups into one category and assume they will all take identical actions.
In addition, central banks play a huge role in the economy. They affect the supply of funds, which then indirectly affects the level of interest rates (this is Monetary Policy). This is absent from the model.
A specific limitation: The model excludes households borrowing money from banks
Take a look at the financial sector, which includes banks. According to the model, households deposit their savings with the financial sector.
But where is household borrowing?
The model does show the financial sector investing in businesses — lending firms funds so they can expand and grow. However, the model does not show households borrowing money from banks.
This is a huge flow in the economy. For example, according to the Australian Bureau of Statistics (ABS), in December 2021, households took out nearly $33 billion of new home loans — either to buy a property to live in or to rent out. This is a massive injection into the economy but is excluded from the model.
Likewise, household loan repayments — an ongoing leakage — are also absent.
Another specific limitation: The model excludes firms buying imports
The model shows households buying goods and services from overseas (imports). You can see the flow of money going from households to the international sector. Yet, the model does not show firms buying imports.
Just think about all the goods and services Australian businesses purchase from overseas:
a restaurant purchases fancy cheese from Italy
an outdoor recreation store (like Anaconda) purchases stock from overseas to then sell to local customers
a school buys online products — such as access to the Google or Microsoft suite of products — and this involves money leaving Australia.
These purchases represent a huge flow of income. According to the ABS, in the September quarter of 2021, imports of capital goods (which are mainly done by businesses) totalled around $1.4 billion.
Do these limitations matter?
If we’re using this model to understand the basics of the economy, then no. It helps us understand the mechanics of how money moves around an economy and how the sectors interact with each other.
But like all models, it’s got limitations. We need to know its limitations so we don’t ask the Circular Flow of Income to do too much.
Scared consumers save more
Consumers can save or spend their income. This comes back to the identity Y=C+S.
Yes, consumers have to pay tax. And yes, consumers can use their savings to invest. The key part is that, when consumers receive their pay, they can either spend it now or put it away for later (savings/investment).
My point: the level of savings depends on consumer confidence, and consumer confidence is substantially affected by the economic outlook.
Let’s explain with the use of a graph.
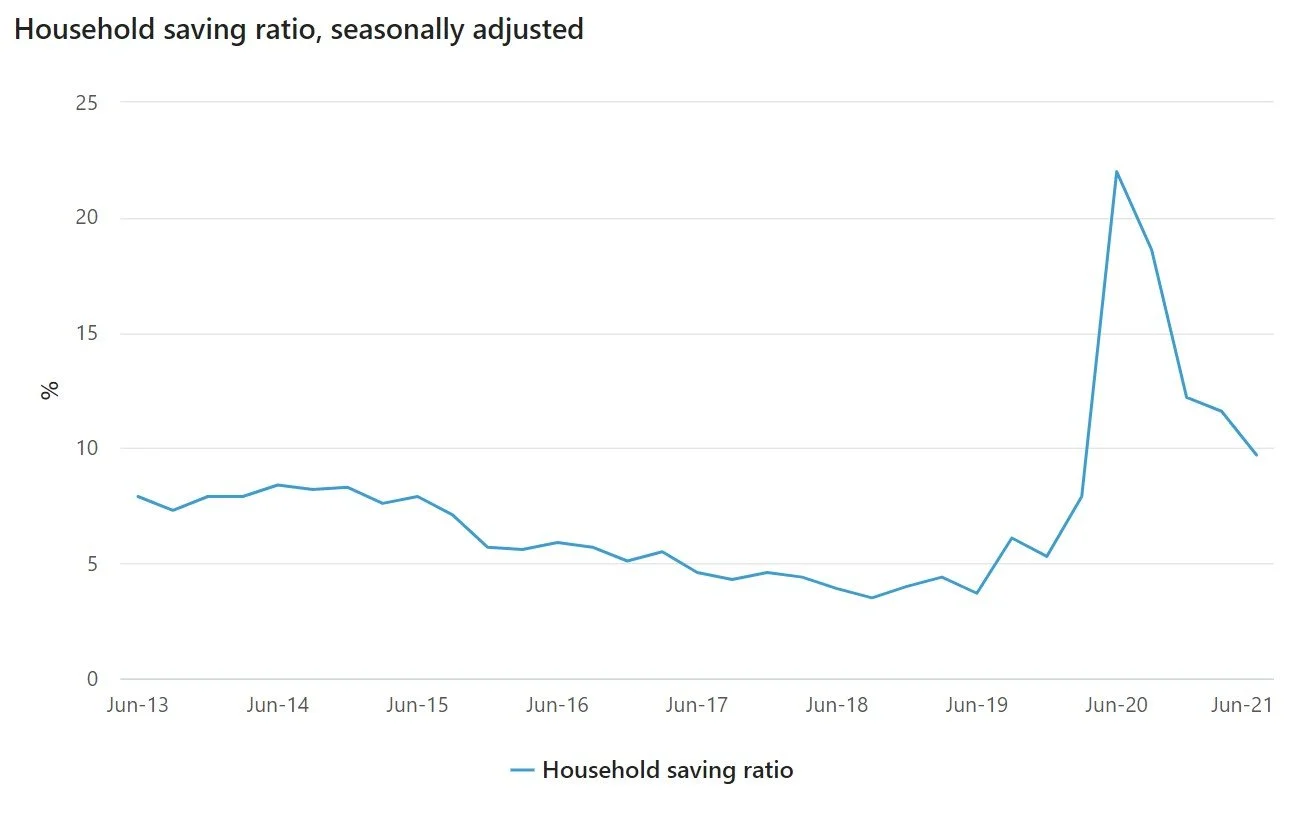
The graph above comes from the Australian Bureau of Statistics from the June quarter national accounts 2021.
Focus on the time frame from around June 2013 until June 2019. You can see that the household savings ratio varies between around 5ish to 9ish per cent (very precise!). This means that, on average, for every $1 of income households earn, they are saving somewhere between 5 and 9 cents. They’re generally spending MOST of their incomes.
Now focus on March of 2020 — see how the savings ratio spikes? This was the first wave of COVID-19 and consumer confidence plummeted. How did consumers respond? By saving a larger chunk of their incomes. In fact, in the June quarter of 2020, the household savings ratio rose to 22 per cent — meaning households were now saving 22 cents for every $1 they earned.
This all comes down to consumer confidence. When the economy is going well, consumers feel confident in the future. They feel confident to spend their money because they believe that the good times will continue and their ability to earn income, to continue spending, will, well, continue!
(You could also think about how their marginal propensity to consume would be higher during ‘good’ economic conditions).
When consumers fear for the future, such as during the height of the first wave of the pandemic, they’ll reduce spending. They don’t know what the future holds. They want to hang on to their funds because they are unsure whether they can continue to earn the same level of income.
(You could think here about how the marginal propensity to save would be higher.)
I’ve annotated the above chart to summarise this info.

I think the household savings ratio is an extremely important statistic. It gives us, as economists, a good indication of consumer confidence. This also has implications for economic growth. This is because savings is a leakage and represents a withdrawal of funds from the economy. The higher the level of saving, the lower the level of consumption, which will put downward pressure on GDP.
I’ve also got a video on the topic you can check out below.
The Five Sector Model (Circular Flow of Income) and economic growth
The Five Sector Model* is a simplified model of how an economy works. It shows how money moves around an economy and involves five sectors only: households, firms, the financial sector, the government sector and the international sector.
[*The Five Sector Model is also known as the Circular Flow of Income Model. Same same.]
If you’re new to the concept, I’ve got a video (below) and you can read more about it here.
In terms of the Five Sector Model, we have injections (money flowing into the economy) and leakages (where money leaves the economy).
The injections are Investment (I), Government Spending (G) and Exports (X). The leakages are Savings (S), Tax (T) and Imports (M).
Let’s look at the relationship between injections and leakages.
When the value of injections EQUALS the value of leakages, the economy is in a state of equilibrium. The economy is neither growing nor slowing; it’s stable.
When the value of injections EXCEEDS the value of leakages, the economy is growing. More money is flowing into the economy than is leaving. As a result, gross domestic product (GDP) is likely rising, unemployment is likely falling and prices are probably on their way up (higher inflation).
When the value of leakages EXCEEDS the value of injections, the economy is slowing. More money is being removed (or withdrawn) from the economy than is being pumped into it. As a result, GDP is likely falling, unemployment is on the rise and prices and probably dropping (lower inflation).
Let’s take an example question. This is Q14 from the 2017 NSW HSC Eco exam.

Source: NESA
If we do the quick maths, we can see that injections equals 115 and leakages equals 125. So this would indicate the the economy is contracting — our answer would be D.
We can also use the Five Sector Model to talk about the budget balance and the trade balance, but we’ll leave this for another post. (For a headstart, check out Q9 from the 2019 HSC Eco exam.)
5 observations on the 2021-22 Federal Budget
The 2021-22 Federal Budget was handed down on 11 May 2021. Here are my five quick observations.
1. The Federal Budget is HIGHLY expansionary
Yes, the size of the budget deficit is shrinking. This means that the budget stance, technically, is contractionary between 2021-22 and 2024-25.
For instance, in 2021-22, the budget deficit is forecast to be $106.6 billion. In 2024-25, it’s forecast to be $57 billion.
But, don’t get it twisted. The budget is still in deficit. The government is still planning to spend substantially more than it earns in revenue (mainly tax revenue). Therefore, the overall impact of Fiscal Policy is expansionary...even if the stance is contractionary between the years.
2. The Federal Budget is about more than stimulating aggregate demand
A major part of the budget involves a large increase in spending on the aged care sector. This is in response to the Royal Commission into aged care which found deficiencies in a number of areas.
This is increased government spending, but it’s not about boosting AD or increasing productivity. After all, this spending is going towards older Australians who are in nursing homes or receiving full-time care at home.
Instead, this measure is largely about improving the quality of life of older Australians. This is an important goal of the government, but it’s more social than economic.
3. The Federal Budget’s boost on childcare spending is an economic measure
The government is offering larger childcare subsidies for parents. The goal here is economic; the goal here is twofold.
One, give people more disposable income by reducing the costs of childcare. (FYI: childcare is very expensive). Parents will spend less on childcare, spend more on consumption...and this will in turn boost AD.
Two, by making childcare cheaper the government is encouraging more parents to use it. The government is actually increasing demand for childcare. This means more parents will be able to work more hours, or potentially return to the labour force. According to Treasury, this will boost the number of hours worked in the Australian economy by 300,000 hours.
4. Fiscal Policy and Monetary Policy are working in tandem
In the past, FP and MP have worked in opposing directions. The RBA had cut the cash rate extensively, however the Morrison Government was keen to protect its goal of a budget surplus and so did not adopt an expansionary stance.
Now both MP and FP are highly expansionary. By working together, it’s hoped their impact on stimulating aggregate demand will be enhanced.
Also, some economists have discussed that the very low cash rate — 0.1% since November 2020 — means that future cuts would not have a major economic impact. If the RBA cuts from 0.1% to 0%, would that dramatically increase consumption and investment? Just remember, the cash rate might be zero but interest rates would not be. The banks would still be looking for a profit margin.
Instead, FP is helping to take up some of the slack.
5. The Federal Government has committed to a return to fiscal discipline
Fiscal discipline or fiscal consolidation is all about moving from a budget deficit back to balanced or surplus budget outcome. The Morrison Government has told us that, yes, we’re in large deficits and, yes, this will persist for some time...but the size of the deficit will be shrinking and there is a target for a return to less expansionary fiscal policy.
The target? When unemployment falls below 5%.
Overall thoughts
In terms of a ‘conclusion’, I really like this article by economist Steven Hamilton. His point of view is that budget deficits are necessary, for now, to drag Australia along the road to recovery. But they cannot persist forever and the government has committed to turn off the expansionary setting once UE falls below its target.
What's an interest rate?
In an economy, interest rates serve really important purposes.
Firstly, interest rates represent the cost of borrowing funds. When you want to borrow money from the bank, you’ll have to pay an interest rate and this will determine the size of the repayments on your loan.
And if you think about it: higher interest rates, higher repayments, so people are less willing to borrow big stacks of money.
Secondly, interest rates are the reward for saving money in the bank. When you deposit savings in your bank account, the bank gives you an incentive for this behaviour — paying you interest, on your savings, at an interest rate.
Think about this one. The higher the interest rate on savings, the more likely people are to save their money. In terms of their incomes, people can spend or save (and pay tax). Generally, the more they save, the less they can spend (because people’s incomes are generally fixed at a point in time). Think about the identity Y=C+S, where Y is income, C is consumption and S is saving.
So in an economy interest rates function as a cost and a benefit. And, as I’ve suggested, interest rates influence people’s behaviour and the level of economic activity.
Let’s take an example here. In the Australian economy, the official level of interest rates is reduced. This means that interest rates, generally, are lower across the whole economy. This will discourage saving as people earn a lower interest rate on their savings; as a result, they will spend more. In addition, lower interest rates mean lower repayments...so there will be more borrowing and investment in the economy.
As a result, the economy is likely to grow.
Tough times for the Australian economy, says RBA
Four times a year, the Reserve Bank of Australia (RBA) shares its assessment of current economic conditions for Australia and the world. This document is called the Statement of Monetary Policy (SOMP). The SOMP for May 2020 sets out some serious challenges for the Australian economy.
I think, as a student, the most important section to focus on is Section 6: Economic Outlook.
I discussed this section in a previous post that looked at the RBA’s three potential scenarios involving the Australian economy’s recovery from COVID-19.
In this post, I’ll take a look at some specific economic forecasts from its May SOMP.
Economic growth
According to the RBA, the Australian economy is “expected to record a contraction in GDP of around 10 per cent over the first half of 2020”. Considering Australia’s GDP grew by around 4 per cent in the first half of 2019, this is a huge turnaround — in a negative sense.
Why is GDP expected to plummet? Well, social distancing means people aren’t going to the shops and spending. The RBA forecasts household spending to fall by 15 per cent in the June quarter this year. In addition, consumers are saving more, as people tend to do in times of uncertainty.
Australia is also not receiving international visitors and their tourist spending. This is classified as export revenue for Australia, and a component of aggregate demand (AD). Less exports mean less economic growth for Australia.
On the flip side, Australians are expected to spend much less on imports.
Unemployment
The RBA estimates that total hours worked in the Australian economy will fall by around 20 per cent in the June quarter (the three months to June 2020). In addition, the RBA says unemployment could rise to around 10 per cent by the same point in time.
Considering the unemployment rate was 5.2 per cent in March 2020, this could represent a near doubling of the number of Australians out of work.
But here’s the thing: while the unemployment rate may not increase by this much, we should still be concerned.
This is because of what’s called “the discouraged worker effect”. This is when an individual gives up looking for work because they don’t believe they will be able to get a job. If people give up looking for work, they’re not considered unemployed and they’d join the hidden unemployed.
(In Australia, to be considered unemployed, you must be out of work and actively seeking a job.)
So Australia’s unemployment rate may not increase by the expected amount, but the economy would still have lost substantial labour resources.
Inflation
Australia, for some time pre-COVID-19, has recorded relatively low inflation rates. This has been part of the reason why the RBA had steadily cut official interest rates.
Due to the pandemic, the RBA expects inflation to turn negative in the June quarter. So: Australia would record deflation.
Why would this happen? Two main reasons. One, fuel prices have fallen dramatically. Just have a look at this chart of unleaded petrol prices in Sydney and how they’ve fallen this year.

Source: PetrolSpy
Two, the Federal Government is providing free childcare to families. So the price of childcare has fallen from something to, well, nothing. These two factors will drag down headline inflation.
Three roads to recovery: The RBA's scenarios for the Australian economy (COVID-19)
Four times a year, the Reserve Bank of Australia shares its assessment of current economic conditions for Australia and the world. This document is called the Statement of Monetary Policy (SOMP). The SOMP for May 2020 sets out some serious challenges for the Australian economy.
I think, as a student, the most important section to focus on is Section 6: Economic Outlook. This is the section that I’ll be discussing in this post.
Three scenarios for recovery
An important part of May’s SOMP is that the RBA has set out three scenarios for Australia’s recovery from COVID-19.
Let’s start with the RBA’s “baseline scenario”. I think we can characterise this as the forecast where things steadily improve. Here are some elements of this scenario:
Australia’s social and business restrictions continue to be relaxed and are mostly removed by the end of September 2020
The spread of COVID-19 in Australia remains limited
GDP growth turns around in the September quarter and the Australian economy steadily improves.
Next, is the RBA’s more optimistic scenario. Here, Australia is more successful in containing the virus’s spread; restrictions are eased much more quickly (well before September); and business and household confidence is not as damaged and can therefore recover more quickly.
Finally, we have the RBA’s more pessimistic scenario. Here, the outbreak persists or flares up again, which would prolong restrictions and delay the reintroduction of activities such as international travel. This situation would result in greater damage to business and consumer confidence, with more jobs being lost and businesses failing.
There are big differences in outcomes between the three scenarios. Have a look at the graph below.

A couple of things to note. The value of GDP in December 2019 is given an index value of 100. So, if GDP falls below the December 2019 level, the index will dip below 100; if GDP rises above the December 2019 level, the index will be above 100.
Under the RBA’s baseline situation (pink), Australia’s GDP will grow beyond its December 2019 levels in around late 2021. In the optimistic situation (yellow), Australia’s GDP could turn positive by early 2021. And in the pessimistic scenario (the sad brown colour), Australia’s GDP will still be below the December 2019 levels going into 2022.
You can see the same thinking for unemployment in the graph below. Just look at the difference between optimistic and pessimistic situations. (With unemployment, the measure is the unemployment rate, so a lower number is better).

So what actually happens? Which scenario really takes place? We’ll have to wait and see.
What shape will Australia's recovery be?
Will Australia’s economic recovery be short and sharp? Or will it be protracted, with economic growth remaining sluggish for sometime following COVID-19?
Depends on who you ask.
The source for this discussion is a great article by the economist Jason Murphy titled Coronavirus Australia: What if the economic recovery is not V-shaped?
Let’s start with the optimistic view: the V-shaped recovery. This looks like it sounds: a plunge down, small time at the bottom, and then a quick escalation up. According to the International Monetary Fund (IMF), this is how Australia’s economic recovery will proceed.

V-shaped economic recovery. Source: news.com.au (click through for article)
As Murphy writes: “This is a very bad recession. But at least it is quite short. The assumption the IMF makes is that the economy bounces back when the virus is defeated.”
Okay, but what if the IMF is wrong?
The pessimistic alternative is an L-shaped recovery. Basically, growth drops (the vertical line of the L), and then we spend a long time along the bottom of the L until growth speeds up. This is a more painful economic recovery as it takes much longer to see a rebound in economic growth rates and employment.

Source: The Conversation (click through for article)
This is how Greg Jericho, The Guardian’s economics writer, describes the L-shaped scenario: “Finally there is the dreaded “L” shape, in which the economy stays weak for even longer – five to 10 years of barely enough growth to keep unemployment flat, but not enough to improve things all that much.”
So what happens next? It’s going to be a wait and see. In terms of Australia, it will depend on the success of re-opening the economy and getting life and business back to normal.
How bad is COVID-19 for the Australian Economy?
What will be the impact of COVID-19 on the Australian economy?
The Australian Financial Review asked this very question of a number of economists.
The answer? No-one knows for sure. But economists generally believe it will be very negative for employment and economic growth in Australia.
The AFR article found that economists forecast Australia’s unemployment rate could rise from its current rate of 5.1 per cent (as of February 2020) to 9.4 per cent. This would represent 1.22 million people out of work.
In addition, economists stated that the economy could shrink by 3 per cent. Not to 3 per cent, but by 3 per cent. This would take the Australian economy into negative economic growth and a recession. According to journalist Aaron Patrick, this would create “the worst recession most living Australians have experienced”.

The AFR article. Click through to read it.
Let’s take a look at some of the individual economists’ views. The article spoke to UBS (an investment bank) economist George Tharenou who said that unemployment could reach 10 per cent if businesses weren’t quickly able to operate as normal.
As of late March, restaurants and cafes around me are restricted to take-away only which has significantly reduced their daily revenues and led to them standing down or letting go of staff. My local cafe has gone from 80 seats and maybe 10 staff to no seats and four staff.
Independent economist Saul Eslake, who was chief economist at ANZ Bank, said that unemployment would peak at 7.5 per cent as the Federal Government’s stimulus packages helped business keep on staff.
As of late March 2020, the Morrison Government had announced two stimulus packages worth around $84 billion with a range of measures targeting businesses to help them retain staff during this challenging time.
Employment is rightly regarded as a major issue right now. Just think about the flow on effects of a significant rise in unemployment. Consumers lose confidence and incomes, which reduces demand for goods and services, which could drive unemployment even higher. Derived demand (the fact that demand for labour is derived from the demand for goods and services) would work in a negative sense.
This is why government intervention to keep employment as robust as possible is so important right now.
The Australian economy in 2020 (maybe)
What should we expect from the Australian economy in 2020?
Forecasting the future is a tough game, but economist Stephen Koukoulas has given it a go. In an article for Yahoo Finance, Koukoulas has taken a look ahead into the future for the Australian economy. I’ve focused on four of his predictions and you can read his full article for more.
Australia’s Economic Growth
In 2019, Australia’s annual growth in gross domestic product (GDP) was relatively weak. GDP averaged around 1.7 per cent in annual terms. Compare that with the government’s goal for economic growth of around 3-4 per cent in annual terms.
In his article, Koukoulas presents an optimistic case for Australia’s GDP. He suggests it could reach 2.5 per cent by mid-2020 and perhaps as high as 3 per cent by the end of this year.
His relative optimism is based on three factors:
A rise in public sector spending, particularly in infrastructure (this represents government spending, or G, in the aggregate demand equation)
Increased business investment, potentially helped by record low interest rates in Australia
Increased consumption, boosted by a recovery in consumer confidence and the wealth effect (where rising asset prices, house prices in Australia’s case, encourage consumers to boost spending).
Australia’s Unemployment
In 2019, Australia’s labour market was relatively weak and unemployment did not budge far from the 5 to 5.2 per cent range. Koukoulas believes UE could rise even further to around 5.5 per cent in 2020.
But! If the predictions around higher economic growth come true, unemployment will likely fall. Koukoulas states that if GDP growth hits 3 per cent, then we will see noticeable falls in unemployment and underemployment.
Why is this the case? Well, if economic growth rises, this means there is greater production of goods and services in the Australian economy. To achieve this, local firms will need additional factors of production (or resources) — particularly labour. They will demand more labour, which will push down UE. (This is known as derived demand, where the demand for labour is derived from the demand for goods and services).
Inflation in Australia
The Reserve Bank of Australia’s goal is to keep inflation between 2 to 3 per cent over the course of the business cycle. This is known as the target band. For the duration of 2019, Australia’s inflation rate was below the target band.
Koukoulas says if the economic growth mentioned above takes place, inflation will likely rise to 2 per cent or to sit inside the target band. This demonstrates the link between economic growth and inflation: as economic growth rises, the demand for goods and services will also rise, leading to higher prices and inflation.
The Australian Dollar
In late 2019, the $A traded around the US$0.66-US$0.68 mark. However, Koukoulas believes the $A could be trading as high as US$0.77 in 2020.
He presents two potential reasons for this appreciation:
Improving global economic growth will lead to higher demand for Australia’s commodity exports. This will increase demand for the $A as buyers need local currency to purchase Australian exports.
Improving domestic conditions could lead to greater investment in the Australian economy. To participate in this, foreign investors will need $A, which will also cause the currency to appreciate.
One point I would add here is that a stronger $A will make exports more expensive and less internationally competitive. This could result in Australia actually selling fewer exports, which may have negative consequences for the trade balance and the Balance of Payments.
We’ll be watching this year to see how these forecasts unfold.
The business cycle
The business cycle demonstrates fluctuations in the level of economic activity over time. More simply, the business cycle is a graph that shows how the output of goods and services, measured by gross domestic product (GDP), varies over time.
We tend to highlight four stages of the business cycle. I’ve matched them with the letters from my graph below.

‘Business cycle’. Artist: Mr Symonds
Point A: The upswing
This is where the economy is expanding (GDP is growing). It is producing more and more goods and services. Hooray!
At this stage, here’s what we’re seeing:
Rising incomes
Higher consumption and investment
Unemployment is falling, as firms need more workers to meet the growing demand for goods and services
Part B: The BOOM
This is the peak point of economic activity. Essentially, the economy’s output is getting ‘maxed out’ and extra resources are in short supply. As a result, production costs rise which leads to growing inflation across the economy.
Given the rise in inflation, the government and the Reserve Bank of Australia (RBA) might need to intervene with contractionary macroeconomic policies (fiscal and monetary) to slow things right down.
Part C: The downturn (or downswing if you prefer)
Economic activity slows, leading to a fall in output. We’re likely to see less demand for goods and services, which leads to less demand for labour, resulting in a rise in unemployment. Incomes will also fall as a result. This are getting worse, economically speaking.
Part D: The recession
This is a very difficult situation. Output has fallen further leading to less demand for labour, lower wages and higher unemployment...which in turn leads to less demand for output and even lower wages and higher unemployment, and so on. Prices are falling and an economy may even experience deflation (not a good thing — see here).
To combat this situation (to fix this situation), the government and RBA will likely need implement expansionary macroeconomic policies to accelerate economic activity.
Feel free to draw the business cycle diagram in short answers and essays to illustrate your point. It can add a little extra to your responses.
Maximum multiplier madness (2013 HSC exam)
Here’s a past question from the 2013 NSW Economics HSC exam. It’s multiplier focused, for maximum multiplier madness.

Source: NESA (click through for full exam)
This is a bit trickier than some other multiplier questions because it’s a different way of examining the same content. There are no numbers, no need to hunt for changes to national income or the multiplier itself.
Still, I think the best way to play this is to actually use numbers.
For instance, the question tells us the MPC has declined. So, let’s create two scenarios:
Scenario one: MPC is 0.6
Scenario two: MPC is 0.3.
If MPC is 0.6, then MPS is 0.4. So the multiplier (k=1/MPS) would be 2.5 in scenario one.
Cool. Then, if MPC is 0.3, then MPS is 0.7. So the multiplier (1/MPS) would be 1.43 (2dp).
So, as the MPC falls, the size of the multiplier shrinks. This makes sense because the less spending that takes place (MPC), the less money that gets multiplied around the economy.
And if the multiplier falls, then the initial injection of aggregate demand will be multiplied fewer times and result in a fall in equilibrium income.
Hence, our answer is B.
You can also see the worked solution below.
Solution for the question starts at 2:47.
Making aggregate demand simple(r)
Aggregate demand (and supply) can be relatively complex concepts for students.
I was teaching AD one day and thought about how when we talk about aggregate, we’re focusing on total. So if think about AD we’re thinking about every individual demand curve in an economy added together.
In terms of demand curves, it’s the sum of Dean’s and Daniel’s and Hannah’s and mine and yours and...you get the picture.
This description might help students clarify their understanding. Check out the video below too.