Four graphs that explain the 2022 Federal Budget
QUICK SUMMARY
The 2022-23 Federal Budget was handed down in March 2022
The Morrison Government is forecasting ongoing budget deficits (government spending exceeds government revenue)
However, the Morrison Government forecasts that the size of the budget deficits will shrink over the next decade
The most important factor: the reduction in government spending and increase in tax revenue as the economy improves during the COVID-19 pandemic.
In this blog post, I’ll look at these four graphs (click the links to jump there):
Total government payments (spending) and receipts (revenue)
Size of Australian government debt
Australia’s government debt levels compared to other advanced economies
Graph one: The budget balance
This graph (labelled Chart 3.2 below) shows how the budget deficit will shrink to approach a balanced budget by 2032-33.

Overall, this graph shows the size of the budget balance as a percentage of GDP. If the number is positive, Australia has a budget surplus. If the number is negative, Australia has a budget deficit. If the number is zero — the budget is balanced.
Look at the black line. Before COVID, the federal budget was balanced and potentially returning to surplus. Once the pandemic hits, the government significantly increases spending to help ease the effects of COVID. As a result, the black line plummets and Australia’s budget deficit peaks at around 6 per cent of GDP (the -6% number).
Then follow the blue line. This is the Morrison Government’s forecasts for how the budget balance will change. The point: the government expects the budget deficit to shrink.
In economic terms, this is known as “fiscal consolidation” or “fiscal repair”, where the government is running contractionary fiscal policy to reduce the budget deficit and return to a balanced or surplus budget.
So the government is forecasting an ongoing improvement in the budget balance to approach a balanced budget in 2032-33. Note: the further out the forecasts, the less certain we can be about them.
Graph two: Total government payments (spending) and receipts (revenue)
This graph (labelled Chart 3.8 below) shows that Government spending spiked during 2021 and is substantially falling as the temporary COVID-related spending decreases or ends.
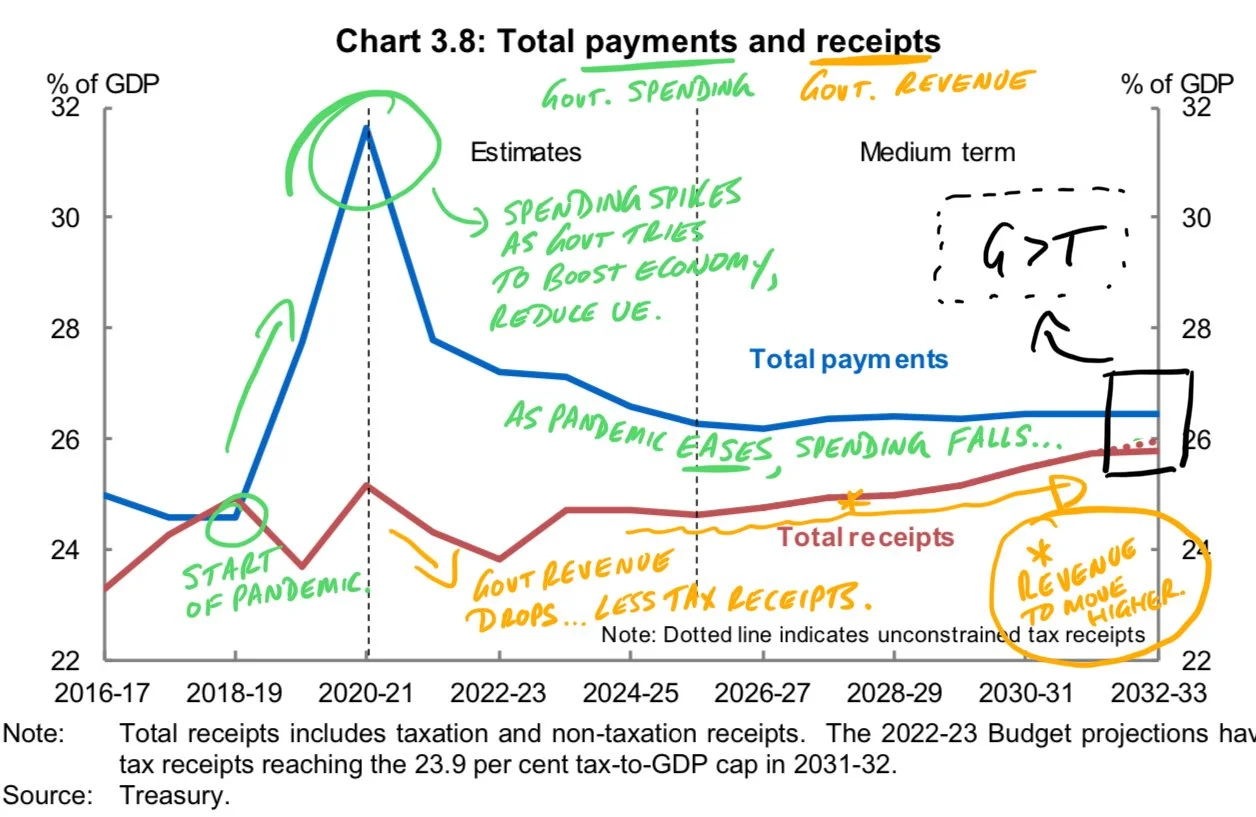
The red line is government revenue, which mainly comes from individual and company tax. The blue line is government spending, which is dominated by spending on welfare payments.
Focus on the left hand side of the graph. You can see that the blue and red lines intersect. This shows us that spending was equal to revenue and the budget was balanced.
As the pandemic starts, government spending significantly increases. You can see that government spending peaks at around 32 per cent of GDP as the Morrison Government tried to offset the worst impacts of COVID. This included significant spending on Job Seeker and Job Keeper programs that aimed to keep people employed, even as businesses had to temporarily close or restrict trading, and stop unemployment rapidly rising.
At the same time, revenue decreased at certain points — but not as significantly. This was due to lower tax revenue as more people were unemployed and companies earned lower profits (because they were forced to shut during lockdowns).
Take a look at the period from 2022-23 onwards. Pandemic-related spending is projected to substantially fall. At the same time, as the Australian economy is forecast to recover and grow more rapidly, government revenue is projected to increase. This will shrink the difference between government spending and government revenue.
This, in turn, will shrink the size of the budget deficit.
So the reason why the government is forecasting smaller budget deficits is because:
Less spending on programs that were designed to protect the economy from the effects of COVID
More revenue as the Australian economy recovers from COVID.
This is evident from the graph — the shrinking distance between the blue and red lines.
Graph three: Size of Australian Government debt
According to the 2022 Federal Budget, the Morrison Government forecasts that the size of federal government debt will shrink more quickly than previously thought.
This chart (labelled Chart 3.1 below) shows the size of the federal government’s debt.

A quick note about debt and deficit. The budget deficit means that there is a discrepancy between government spending and revenue. Government spending exceeds government revenue. This creates a deficit of funds in the federal budget because the government is spending more than it earns.
And if the government has a deficit, it needs to find the funds to pay for its extra spending. To fund the gap between spending and revenue, the government will borrow money from overseas. That is, it will incur more debt.
Have a look at the left hand side of the graph. Pre-pandemic, the government’s debt was relatively flat around 30 per cent of GDP. COVID hits, the Morrison Government starts spending to try and protect the Australian economy and stop unemployment soaring. To pay for this extra spending, the government borrowed increasing amounts of money from overseas.
The three lines show us that, over the past three years, the government has forecast that the amount of funds it needs to be borrow will be less and less. For example, in the 2020-21 budget, the Morrison Government forecast that government debt might get to around 55 per cent of GDP. However, as the Australian economy has improved and the budget deficit is projected to shrink, the amount of debt is also expected to shrink. Now, the government expects debt will fall to around 40 per cent of GDP by 2032-33.
Here’s the key thing: as the budget deficit shrinks, the government will need to borrow less money to fund the gap between spending and revenue. This means the size of government debt will also fall.
Graph four: Australia’s government debt compared to other advanced economies
The Australian Government’s debt (as seen in Chart 3.9 below) can be considered comparable or low compared to other developed economies.

The graph above shows how all G7 economies have increased spending and their debt levels because of COVID. However, this graph shows that the size of Australia’s debt levels is either similar to or substantially lower than the debt levels of G7 economies.
For example, in the US, government debt levels exceed 100 per cent of GDP. And these levels are even higher in Italy and Japan.
The important thing to think about is that the larger the amount of debt, the longer it will take to repay and the greater amount of interest payments required to service these loans. This could be an issue as global interest rates are expected to rise over 2022.
One last thing
Here’s a small summary table from the 2022 Federal Budget that shows how the Morrison Government expects the budget deficit to shrink over the next five years. These numbers are great to have handy for essay questions on fiscal policy.

And here’s a short explainer on how changes in the federal budget then affect the Australian economy.